A Look Back at 2020

There’s a thing I like to do, when it’s cold and dark and the outside world has gone all drearified and grim. I like to curl up in a blanket by the fire, pour a glass of wine, and go spelunking in old sales data to make some graphs.
(Yes, I’m aware that I have a problem — I’m working on it)
At any rate, we wanted to start off 2021 — and properly inaugurate this blog! — by taking a look back at antique & vendor mall sales in what has been a very strange year. We had a global pandemic & economic crash, the UK let itself fall out of Europe, Australia let itself catch on fire, and here in the US we had a presidential election that was…one for the books.
So. How’d all that affect antique sales?
For a start, let’s look at the number of transactions per week in stores using Quail:
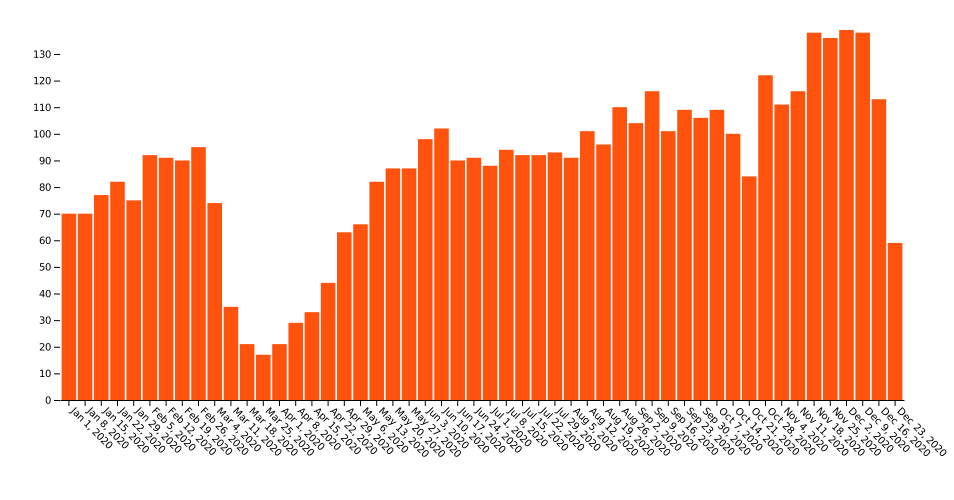
Overall, stores ran an average of 87 sales per week (~12 per day) over 2020 — and that’s taking into account an incredible slowdown in sales over March and April. Other than the pandemic + lockdown period, 2020 looks pretty much like past years we’ve seen in Quail: a slow start in January and February, followed by a steady uptick in sales until it peaks in mid-December. Our takeaway? If you see fewer customers in the next 6 weeks or so, don’t freak out — they’ll be back in March (assuming we don’t end up in another spring lockdown).
That’s the number of transactions (and, by extension, roughly the number of paying customer); the next question is, how much are those people spending when they do come in and shop? To answer that, let’s take a look at the average weekly total processed by stores using Quail:
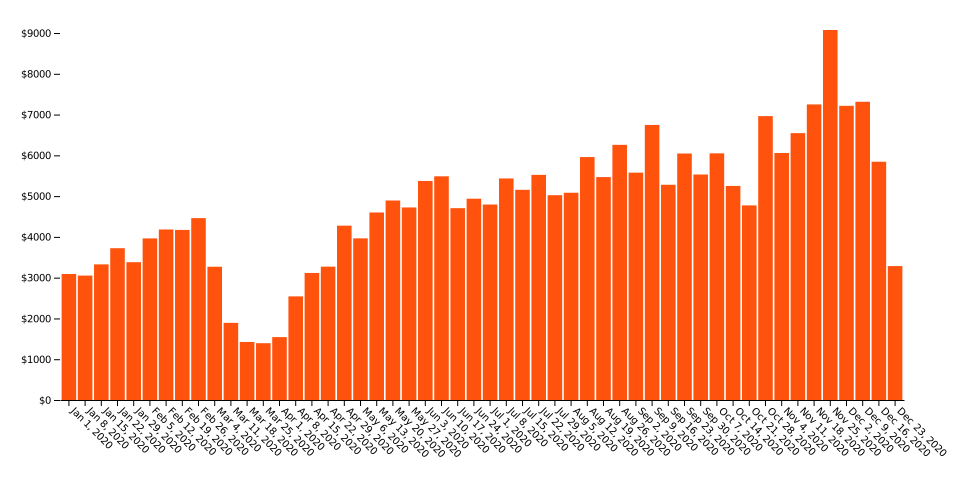
This chart mostly tells the same story (bad March and April, fast recovery after) as the previous one — but there’s a couple interesting points to take away. Most interesting to me is the week of Thanksgiving (for us, it’s more like the week of “Small Business Saturday”!). Compared to the weeks before and after in that week stores processed an average of around $2000 more sales. That’s interesting, because the according to the transaction count those stores were seeing roughly the same number of (paying) customers: that tells me that about the same number of people go antique shopping on that weekend as the rest of November/December, but they spend more — a lot more — that weekend, probably because of sales & specials. Good to confirm!
The last thing I want to show you is the average transaction value: how much each (paying) customer spent on average each week:
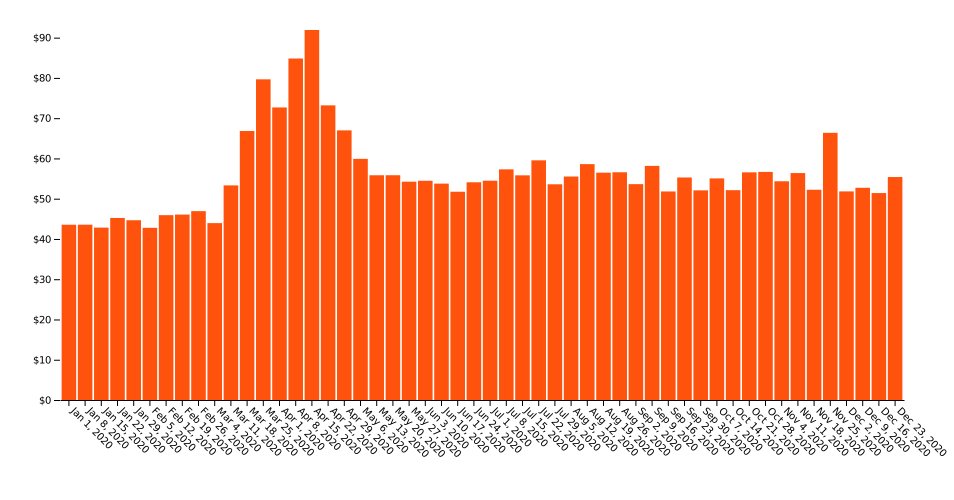
As we expect, we see a surprisingly high average transaction value for Thanksgiving week. More interesting, though, is the lockdown period in March and April, where it looks like those few folks who were still shopping were buying way bigger-ticket items. From talking to stores and vendors we know a lot of that is due to stores closing their doors and doing only online or curbside pickup, and focusing on selling a smaller number of higher-priced items. From looking at the sales data in Quail, we can confirm that — at least for a significant fraction of stores using Quail — that strategy absolutely worked. We estimated that the average store was losing $3000 per week during lockdown; that number would have been much higher had stores not found other ways to keep sales coming in.
That’s all from us this week — Chris will be back next week with some hard-won knowledge about how to run an antique mall. Should you charge consignment? If you do charge consignment, how much should it be? Check back then and he’ll, uhh, let you know.
Happy Selling,
— Trevor